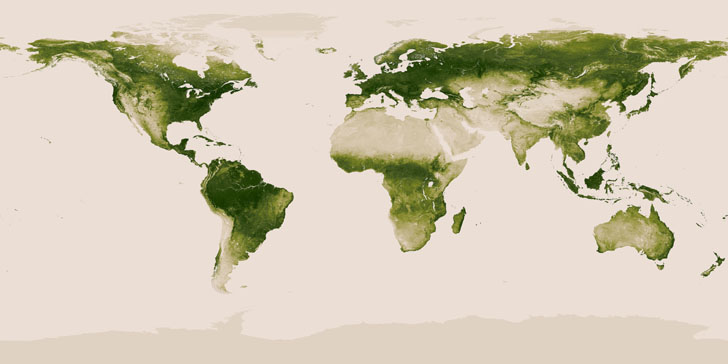
The image generated using data from the NASA/NOAA Suomi NPP satellite reveals differences in greenness among various continents. The satellite data is collected based on the difference between how much energy is absorbed by the land versus how much is reflected back into space.
Plants absorb visible light for photosynthesis. When the vegetation is lush, nearly all visible light is absorbed by green leaves, and near-infrared light is reflected back into space. So, for deserts and snow-covered regions where the vegetation is low, more visible light and infrared light will be reflected.
The Visible Infrared Imaging Radiometer Suite (VIIRS) sensor on-board the satellite is capable of recording these different types of visible and near-infrared light. The VIIRS sensor collects 330 megabytes of data every minute.
The vegetation image generated every week is about 13 gigabytes and 80,000 x 40,000 pixels. Take the below video tour of vegetation on our planet.
These data are collected during cloud-free days over various regions of the planet and organised together to form a single cloud-free image of the planet. These images are helpful in understanding environmental issues and the impacts of urbanisation on our forests.
For a high-resolution image, visit http://www.nnvl.noaa.gov/green.php
Credits: NASA and NOAA
